
5 Best Intro Courses in Statistics and Data Science

Learning statistics and data science opens access to millions of career opportunities across modern technology, research, and corporate sectors. Because data-driven decision-making sits at the core of organizational strategy, building practical fluency in both theoretical metrics and applied programming has become an essential professional asset. Introductory courses serve as an accessible entry point, allowing newcomers to evaluate the discipline, understand predictive mechanisms, and transform raw numbers into actionable strategic insights.
Historically, statistics existed as an abstract mathematical field dedicated to collecting, reviewing, and presenting numerical information. The rapid growth of computing power merged these mathematical frameworks with software engineering, giving rise to modern data science. Today, practitioners must navigate foundational statistical theory alongside programming tools such as Python, R, and SQL to clean datasets, run experiments, and evaluate algorithmic predictions.
Key takeaways
- Introductory courses blend classical mathematical principles like probability and hypothesis testing with modern programming languages like Python and R.
- Curricula range from rapid, targeted 35-hour skills tracks to year-long academic programs requiring 10 to 14 hours of weekly study.
- Prerequisites vary significantly, with some programs starting from basic tooling while others require prior familiarity with SQL, Python, NumPy, or pandas.
- Capstone projects and functional data products allow students to demonstrate end-to-end analytical abilities directly to hiring teams.
Overview of top-rated introductory programs
Selecting the right course requires balancing your current technical proficiency against the amount of time you can commit. While some tracks emphasize corporate business applications, others prioritize intensive computational theory, regression workflows, or machine learning pipelines.
| Course Name | Curriculum Length | Primary Technical Tools | Core Focus | Final Milestone |
|---|---|---|---|---|
| Practical Statistics | 35 hours | SQL, Python, NumPy, pandas | Practical testing, probability, and analytical metrics | Applied problem sets |
| Data Science Specialization | 10-course series | R programming, GitHub | Foundational tooling, data analysis, and debugging | Data Science Capstone |
| Statistics for Data Science and Business Analysis | Self-paced modular track | Data plotting and visualization tools | Business strategy, confidence intervals, and hypothesis testing | Practical business exercises |
| Data Science: Statistics and Machine Learning Specialization | 5-course series | Machine learning and predictive tools | Statistical inference, regression analysis, and prediction functions | Predictive capstone project |
| MicroMasters Program in Statistics and Data Science | 1+ years (10–14 hours/week) | Python (linear models, deep learning) | Probability theory, machine learning, and advanced computation | Proctored capstone exam |
Detailed course reviews and curriculum pathways
Each of the following programs provides a unique route into analytical thinking, supporting learners with varying career goals and coding baselines.
Practical Statistics
- Estimated Effort: 35 total hours
- Prerequisites: SQL, Python, NumPy, pandas
- Core Subject Areas: Simpson's Paradox, Bayes Rule, hypothesis testing, A/B testing
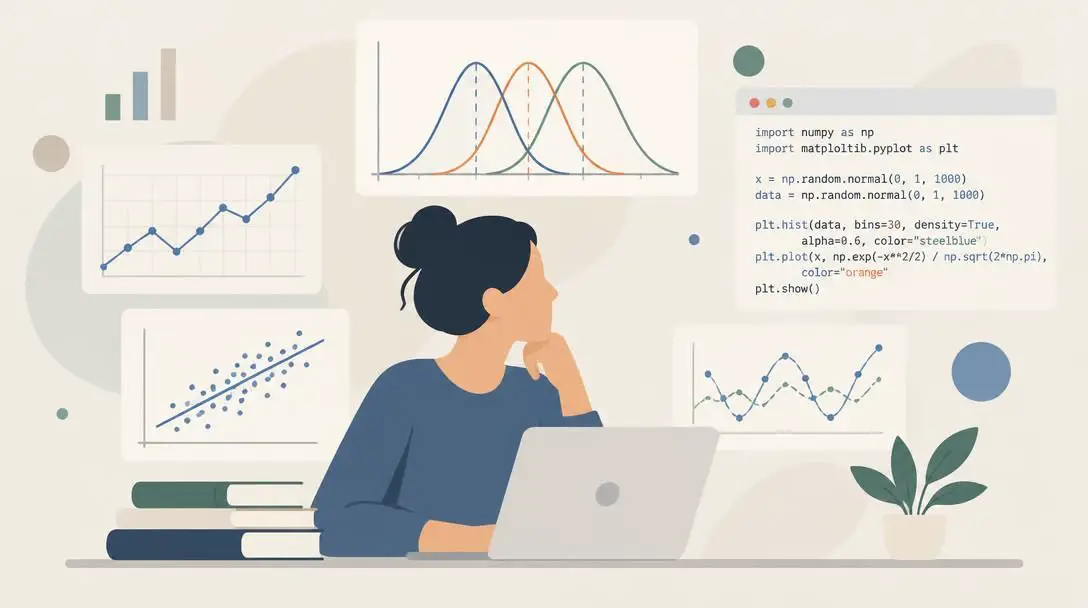
The Practical Statistics course is constructed for learners who want to move past pure theory and focus immediately on drawing accurate conclusions from structured datasets. Rather than forcing students through abstract mathematical proofs, the lessons center on applying concrete statistical metrics to practical analytical challenges.
Because the syllabus assumes prior familiarity with technical tools, you will need a solid foundation in SQL as well as Python libraries like NumPy and pandas. This baseline enables you to dive straight into analytical concepts during the 35 hours of coursework. Core topics include the mathematical mechanics of Bayes Rule, detecting deceptive patterns like Simpson's Paradox, designing reliable hypothesis tests, and evaluating A/B tests to determine experimental impact.
Data Science Specialization
- Originating Institution: Johns Hopkins University
- Format: 10-course series
- Core Subject Areas: R programming, machine learning, debugging, version control
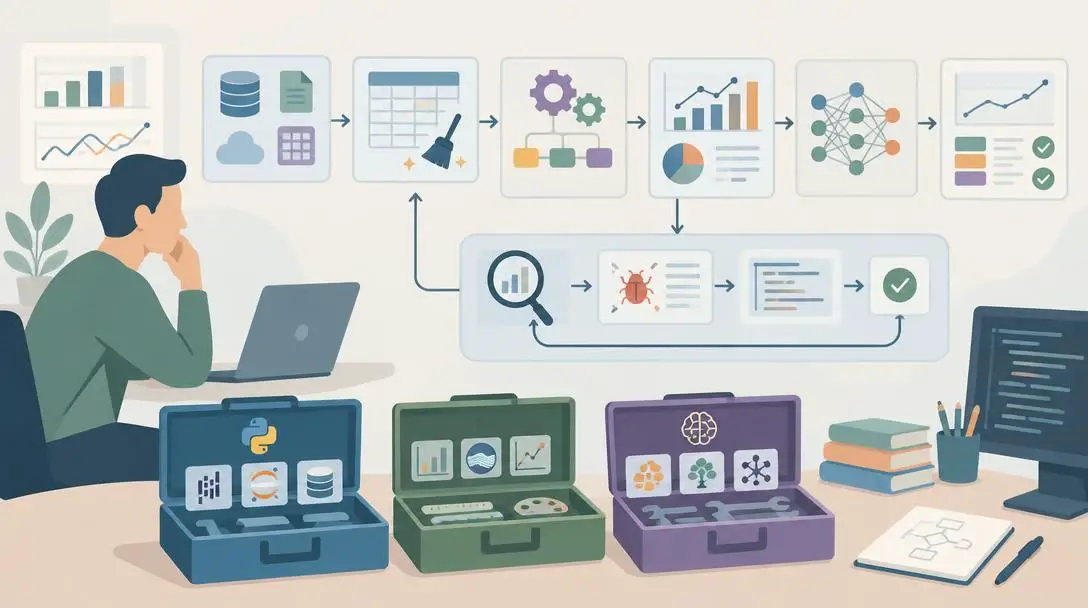
Developed by Johns Hopkins University, the Data Science Specialization provides an extensive introduction to the end-to-end data pipeline. This ten-course sequence is designed to take prospective analysts through the practical mechanisms of modern computing, using the R programming language as its analytical engine.

Instruction begins with "The Data Scientist's Toolbox," an introductory module covering day-to-day utilities, analytical questioning, and fundamental data organization. As you advance through the series, the material covers data analysis, machine learning techniques, and routine debugging strategies. You will also learn version-control workflows on GitHub. The curriculum concludes with the "Data Science Capstone," requiring students to construct a working data product that demonstrates mastery of the entire toolchain.
Statistics for Data Science and Business Analysis

- Instructional Materials: Articles, on-demand video lectures, downloadable resources
- Core Subject Areas: Visual plotting, confidence intervals, hypothesis testing
- Primary Application: Corporate analytics and data-driven business decisions
The Statistics for Data Science and Business Analysis course is specifically structured to bridge theoretical mathematics and everyday commercial decision-making. Geared toward beginners, this track establishes a foundation in baseline statistics before exploring how to interpret and communicate metrics within an organizational setting.
The curriculum emphasizes exploratory visualization, teaching learners how to plot data points clearly so that quantitative patterns can be presented to non-technical stakeholders. Students learn how to calculate and estimate confidence intervals, complete hypothesis tests, and assess variability across distinct data formats. Supported by downloadable assets, reading modules, and video tutorials, the course equips learners to guide organizational initiatives using verifiable numerical evidence.
Mastering introductory statistics allows analysts to translate complex mathematical results into insights that non-technical business partners can easily grasp.
Data Science: Statistics and Machine Learning Specialization
- Format: 5-course series
- Core Subject Areas: Statistical inference, regression analysis, machine learning algorithms
- Final Milestone: Comprehensive predictive workflow capstone
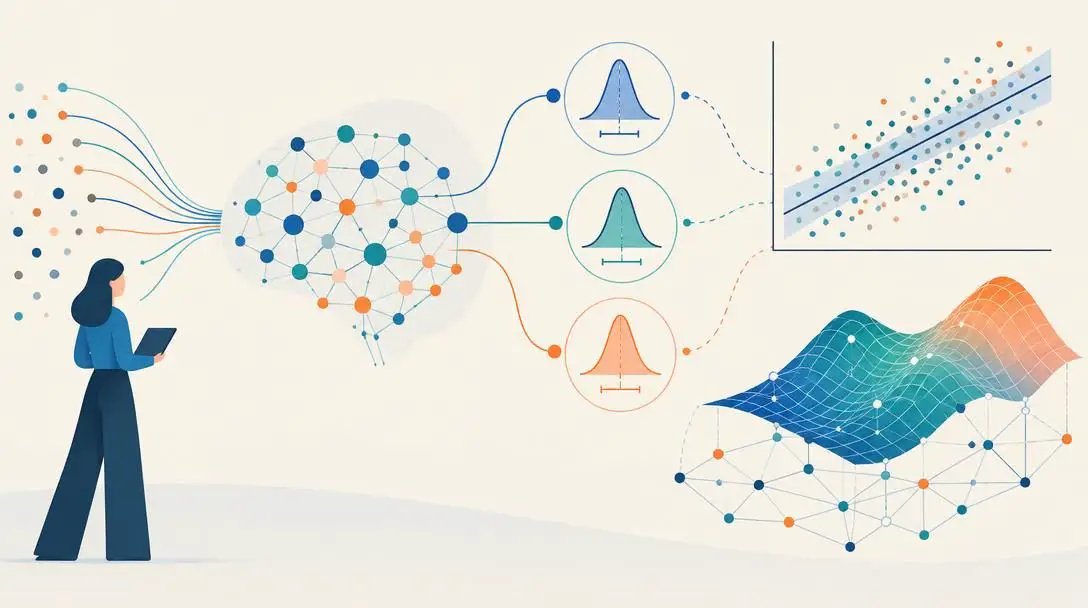
The Data Science: Statistics and Machine Learning Specialization offers a focused five-course progression aimed at building predictive tools and deriving reliable inferences. The collection concentrates heavily on statistical modeling, showing students how to validate conclusions mathematically before deploying machine learning algorithms.
The series begins with "Statistical Inference," teaching methods for deducing broader population patterns from limited samples. The sequence continues through "Practical Machine Learning" and "Developing Data Products," providing direct instruction on how to build regression analyses, tune prediction functions, and assemble interactive analytical software. The final course requires learners to synthesize these skills into a completed capstone project highlighting a full predictive workflow.
MicroMasters Program in Statistics and Data Science

- Weekly Commitment: 10 to 14 hours per week
- Total Duration: Slightly over one year
- Specialized Tracks: Social science data analysis or computational statistical modeling
The MicroMasters Program in Statistics and Data Science is an academically intensive credential designed for deep mastery of quantitative foundations. Requiring a notable investment of 10 to 14 hours every week for more than a year, this program covers the mathematical theories underlying contemporary analytical engineering.

The sequence begins with rigorous instruction in probability theory before moving into core statistical frameworks. Students then progress to applied machine learning using Python, examining linear models as well as modern deep learning architectures. After passing a comprehensive capstone exam, students customize their pathway by selecting either an applied social science data track or a computationally intensive statistical modeling track.
Inside the digital learning environment
Modern online statistics and data science courses use several complementary teaching modalities to reinforce abstract concepts with practical keyboard time:
- Video lectures and technical write-ups: Instructors dissect complex mathematical definitions, demonstrate algorithmic proofs, and walk step-by-step through live code syntax.
- Browser-based coding shells: Many courses run exercises within pre-configured environments or Jupyter Notebooks, allowing students to manipulate data using packages such as pandas, NumPy, or base R without local configuration hurdles.
- Analytical quizzes and evaluations: Regular knowledge checks assess your conceptual understanding of probability distributions, experimental controls, and mathematical logic.
- Applied capstone projects: Culminating assignments demand an end-to-end implementation, requiring learners to ingest dirty data, run exploratory plots, apply statistical tests, and deploy a working data product.
How to succeed in an introductory data curriculum
Completing a challenging technical syllabus requires disciplined study habits and consistent application. Using a systematic framework ensures you retain abstract concepts and build lasting practical competence.
- Verify technical prerequisites before enrolling: Review required coding baselines to make sure you are prepared. If a class requires Python or SQL, spend time studying fundamental syntax before the course starts.
- Establish dedicated weekly study blocks: Protect your schedule by setting aside uninterrupted learning sessions. High-rigor options require steady pacing over many months to avoid burnout.
- Engage in active programming: Avoid passively watching video lectures. Type out sample scripts by hand, experiment with differing parameters, and observe how altering numbers impacts summary statistics.
- Document projects on public repositories: Commit your scripts, exploratory plots, and capstone assignments to GitHub with clean documentation explaining your methodologies and conclusions.
- Prioritize conceptual reasoning over rote memorization: Focus on understanding why analytical paradoxes occur and what your models are truly measuring, rather than simply memorizing mathematical equations.
Mistakes that derail beginning analysts
Newcomers to data science often encounter predictable friction points that impede their momentum. Awareness of these common hurdles makes it easier to navigate coursework successfully:
- Rushing past mathematical foundations: Skipping core principles like probability and confidence intervals to jump straight into complex machine learning architectures makes it difficult to interpret errors or assess model reliability.
- Getting discouraged by software bugs: Errors are an unavoidable part of writing code. Developing structured debugging strategies is a vital professional skill rather than a personal failure.
- Overlooking output usability: An analysis holds value only if colleagues can comprehend and act upon it. Ensure data products, summaries, and graphs communicate findings clearly to non-technical audiences.
- Miscalculating personal time constraints: Enrolling in a comprehensive, year-long program without sufficient weekly study time frequently leads to incomplete courses. Align your enrollment with your actual weekly availability.
Frequently asked questions
Should I learn Python or R first for statistics?
Both languages are widely used across the industry. Curricula like the Data Science Specialization rely on R for statistical exploration and data products, whereas programs like the MicroMasters and Practical Statistics utilize Python alongside libraries like NumPy and pandas. Choose R if your focus is pure statistical analysis, or Python for general computing and deep learning.
How much math knowledge do I need to start?
Introductory courses generally start with fundamental probability, plotting, and descriptive measures before introducing advanced mathematics. However, extended programs that cover linear models, deep learning, and advanced inference benefit from comfort with foundational algebra and mathematical logic.
What is the difference between a standalone course and a specialization?
A standalone course, such as Practical Statistics, concentrates on a specific subject area over a shorter duration like 35 hours. A specialization or MicroMasters program bundles multiple progressive courses together, covering everything from basic developer tools to advanced machine learning and final capstone projects.
Why are capstone projects important in these courses?
Capstone projects require you to build functional data products or perform end-to-end regression workflows on realistic data. These assignments validate your ability to synthesize disparate skills—such as code hygiene, debugging, and statistical inference—into a portfolio asset you can share with employers.
Can these courses prepare me for a career transition?
Yes. Introductory courses provide the baseline competencies needed to evaluate corporate data, write reproducible code, and run statistical tests. Completing these programs helps you determine whether to pursue specialized roles in predictive analytics, business strategy, or social science modeling.
The bottom line
Embarking on a career in data science and statistics does not require an advanced degree before you write your first line of code. Through structured introductory classes, you can systematically master probability distributions, practice debugging workflows, and produce meaningful business projections. By matching your existing coding experience with the right curriculum—whether a 35-hour practical overview or an intensive year-long credential—you will establish the mathematical logic and technical skills needed to turn complex numbers into decisive action.