Is Weather Really More Extreme Now Than 50 Years Ago?
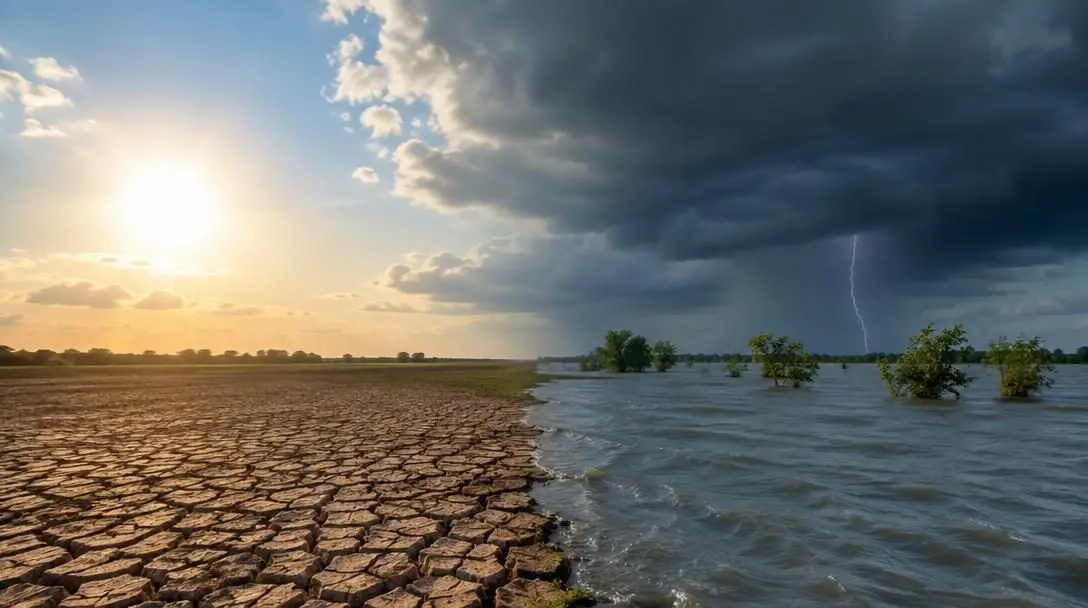
Whenever a catastrophic storm inundates a coastline, a historic blizzard paralyzes transit, or a relentless summer heat dome shatters records, the default reaction is often to assume that our weather has never been so volatile. Human memory naturally filters past decades through a lens of selective nostalgia, retaining sharp memories of a singular childhood snowstorm while smoothing over weeks of routine weather. Without direct access to meteorological ledgers and long-term observational records, estimating whether modern conditions truly surpass the storms of forty or fifty years ago remains difficult.
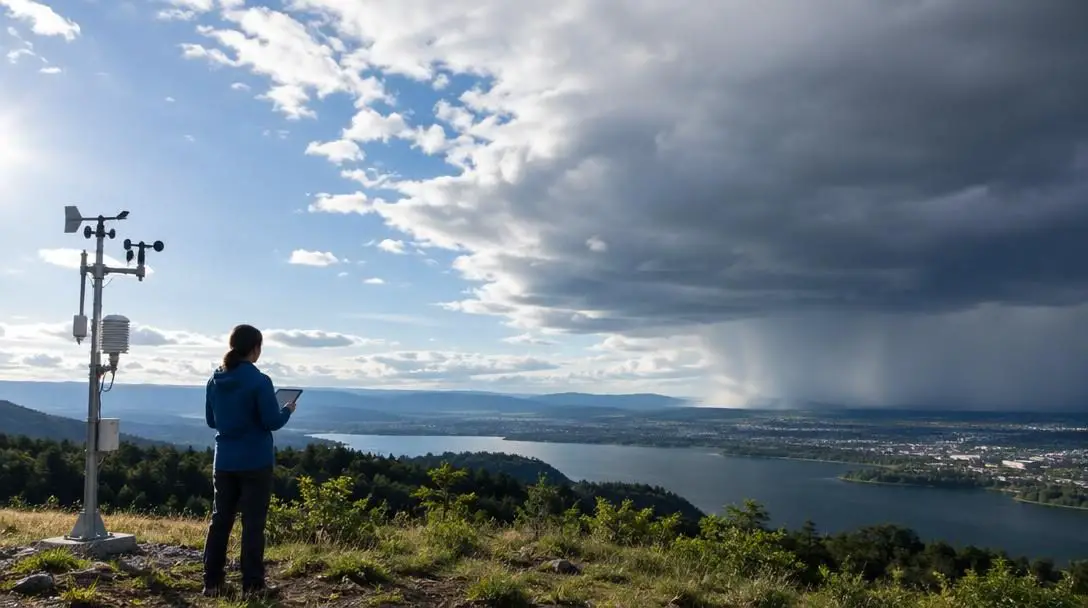
Recent decades have seen sustained public discussion and media coverage highlighting how extreme atmospheric events appear to multiply with every passing season. While climate research confirms an unmistakable warming trend in global surface temperatures, analyzing whether short-term weather extremes are quantitatively more intense today requires dissecting the raw historical data. By measuring temperature variations, rainfall extremes, hurricane frequency, and severe convective activity, meteorologists can separate subjective impressions from historical reality.
Key takeaways
- Global average temperatures have climbed significantly above the 20th-century benchmark of 57.0 degrees Fahrenheit (13.9 degrees Celsius), culminating in 2016 reaching a full 1.0 degree Celsius above that baseline.
- Modern heat waves now occur twice as often as they did in the 1960s, persisting for an average of six days instead of three and reaching higher peak intensities.
- Extreme precipitation has surged dramatically since the 1990s, the single decade that accounted for nine of the heaviest rainfall days recorded throughout the entire twentieth century.
- Tropical cyclone activity has expanded since the 1970s, setting an all-time peak of 150 storms in 2018, with five of the six highest-volume storm years in the United States occurring after 1995.
- Tornado counts remain erratic rather than showing a steady upward march, with decades of fluctuating counts and historical peaks such as the seven maximum-strength F5 tornadoes recorded in 1974.
Long-term temperature records and the mid-century baseline
To determine whether everyday weather is becoming more severe, researchers compare present conditions to multi-generational reference points. Across the 20th century, the planet held an average surface temperature baseline of 57.0 degrees Fahrenheit (13.9 degrees Celsius). For decades, global readings remained predominantly cooler than this historical midpoint. The coolest stretch on record appeared around 1910, when global temperatures plummeted more than 0.4 degrees Celsius below that century benchmark.
This prolonged cool period began shifting as wartime industrial production expanded rapidly during World War II. In 1939, global readings rose above the 20th-century average for the first time on record. This heightened thermal state remained constant throughout the war, not dropping back beneath the baseline until 1946—the first complete calendar year after hostilities ceased. For three decades following this post-war decline, world temperatures hovered in relative equilibrium around the historical average.
By the late 1970s, this period of post-war equilibrium came to an end as global readings began a rapid, sustained ascent. This climb continued over subsequent decades, culminating in 2016, an extraordinary year when the global temperature reached a full 1.0 degree Celsius above the 20th-century average. This shift in base temperatures has altered the behavior, duration, and severity of everyday regional weather patterns.
How distinct weather extremes compare to past decades
The perception of worsening weather cannot be answered with a simple affirmative or negative because different atmospheric phenomena behave under separate thermodynamic rules. Evaluating individual categories of severe events reveals where the atmosphere is demonstrably more extreme today and where historical records display erratic fluctuations.
Heat waves
Prolonged heat spells show the clearest upward shift over the past fifty years. During the 1960s, heat waves across monitored regions lasted an average of only three days, and communities experienced them roughly twice per year. By the 2020s, the typical frequency had doubled to four heat waves annually. Furthermore, the duration of these modern events has expanded to an average of six full days, while their peak temperatures register approximately 0.3 degrees hotter than earlier benchmarks.
Heavy precipitation and downpours
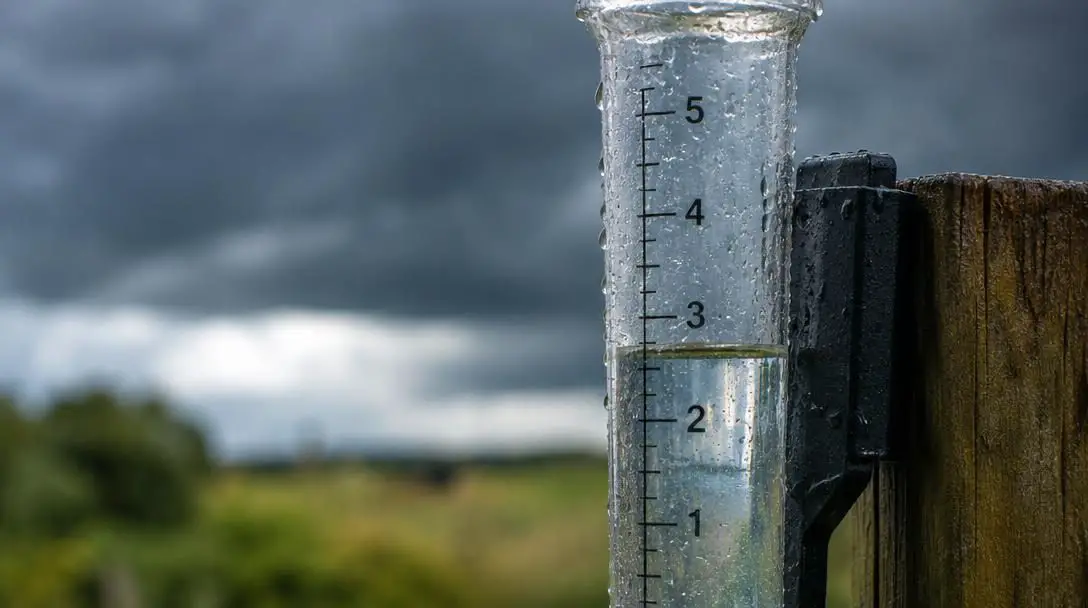
While total annual global precipitation has shifted only slightly over the long term, the concentration of moisture during storm events has altered substantially. Throughout the first nine decades of the 20th century, the frequency of extreme downpour days remained remarkably consistent. This balance shifted sharply in the 1990s, when the annual tally of heavy rainfall days accelerated. In fact, nine of the heaviest precipitation days of the entire twentieth century occurred within the 1990s alone, marking a distinct transition toward sudden, high-volume rain events.
Nine of the heaviest single-day precipitation events recorded during the entire twentieth century occurred within the span of the 1990s.
Tropical cyclones
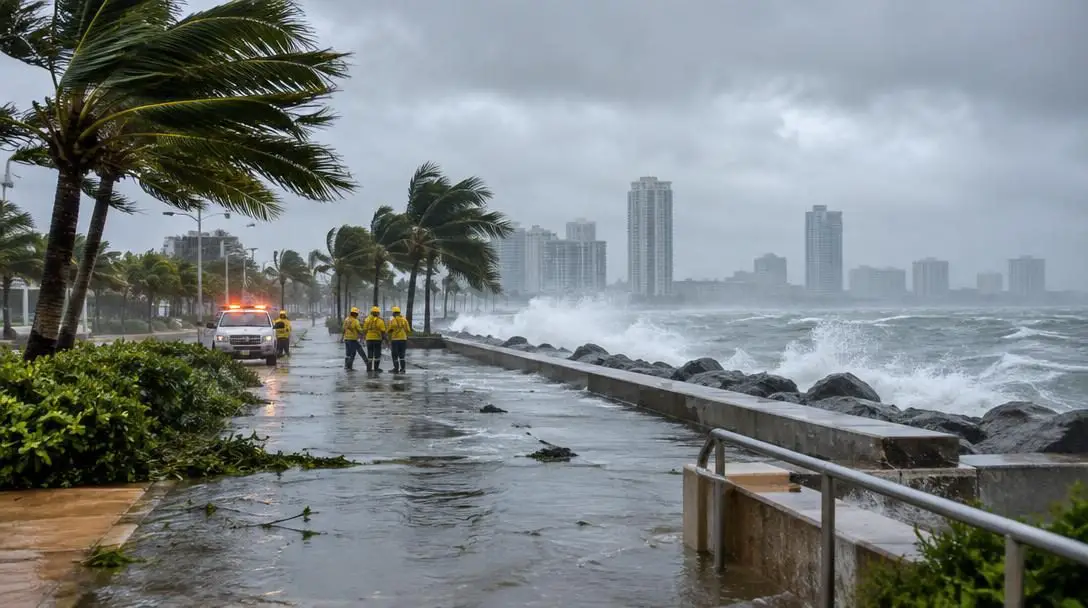
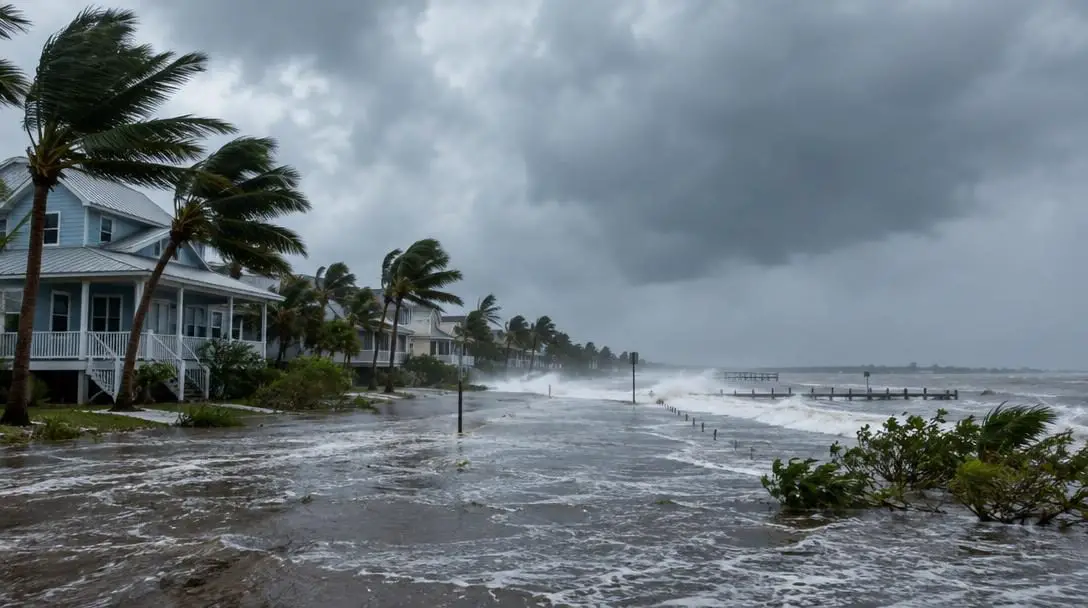
Maritime storms demonstrate a notable upward trajectory in both volume and frequency over the last half-century. In 1973, international tracking agencies logged 118 cyclone storms globally. By 2018, worldwide tropical cyclone frequency achieved an all-time high of 150 storms in a single year. Elevated activity persisted into 2021, which registered 127 systems globally. In the United States, storm seasons have compressed historical records: five of the six years with the highest counts of named tropical systems have taken place since 1995.
Tornado outbreaks
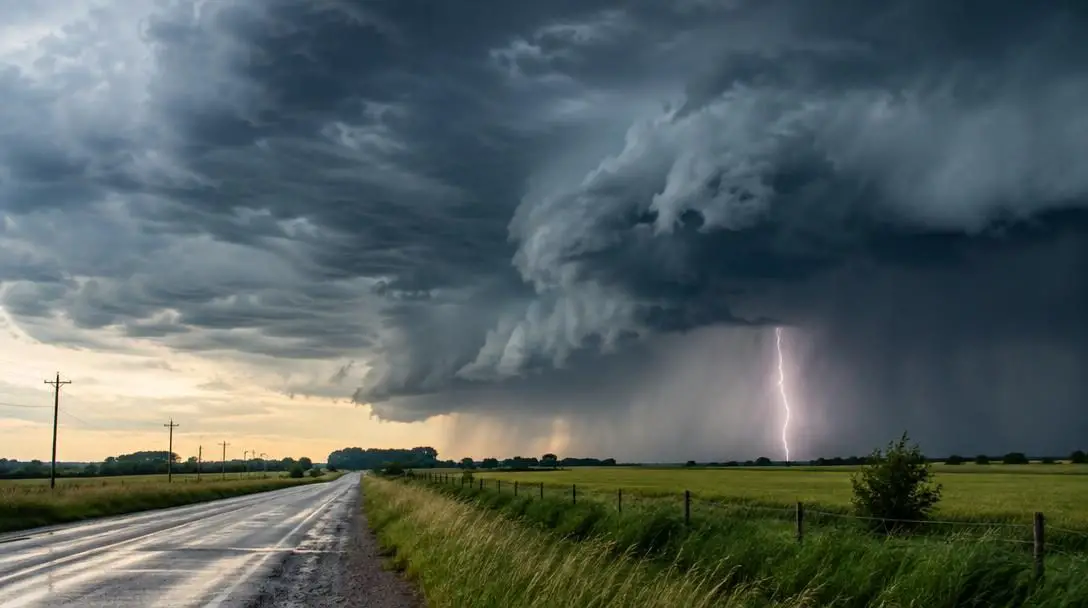
Unlike oceanic storms and heat waves, severe convective storms that produce tornadoes do not exhibit a linear, predictable upward trend. The historical record for tornadoes is defined by high annual volatility. For example, 2016 was unique for recording both the highest global temperature on record and the highest total number of tornadoes. However, when evaluating the top ten years with the most extensive tornado counts, almost every individual decade over the past fifty years is represented. Furthermore, earlier records hold severe outbreaks that remain unmatched; the year 1974 stands out as the only recorded season in history where at least seven distinct tornadoes reached maximum F5 status.
At a glance: Meteorological shifts over time
Comparing observational metrics from earlier eras directly against modern benchmarks demonstrates where atmospheric conditions have measurably intensified over the past fifty years.
| Severe Weather Metric | Mid-20th Century Baseline | Recent Record / Modern State | Observed Trend |
|---|---|---|---|
| Heat Wave Frequency | ~2 events per year (1960s) | ~4 events per year (2020s) | Doubled frequency |
| Heat Wave Duration | 3 days average (1960s) | 6 days average (2020s) | Doubled duration (+0.3° hotter) |
| Global Average Temperature | 57.0°F / 13.9°C (20th-century benchmark) | +1.0°C over baseline (Peak in 2016) | Substantial upward warming |
| Global Tropical Cyclones | 118 storms worldwide (1973) | 150 storms (2018 record), 127 (2021) | Substantial expansion in storm volume |
| Maximum F5 Tornado Outbreaks | 7 F5 tornadoes recorded (1974) | High totals in 2016, but non-linear | Erratic and sporadic distribution |
Practical steps for dealing with modern weather extremes
Because the data confirms that certain storm categories—particularly multi-day heat spells, sudden flash downpours, and intense tropical cyclones—are occurring more frequently than they did fifty years ago, homeowners and municipal leaders must adjust preparation strategies accordingly.
- Evaluate site-specific drainage and flood exposure: Because extreme precipitation days expanded rapidly after the 1990s, consult modernized topographical maps rather than relying on historical mid-century drainage expectations.
- Upgrade residential thermal protection: Retrofit insulation, reflective roofing, and window seals to endure heat waves that now average six days rather than the three-day duration common in the 1960s.
- Assemble multi-day self-sufficiency reserves: Prepare home emergency kits capable of sustaining a household for extended periods following maritime storms or severe regional power interruptions.
- Establish multi-channel communication tools: Rely on NOAA weather radios and localized alert systems for tornadic activity, recognizing that convective storms remain erratic and sudden in onset.
- Inspect structural building integrity: Review roof strapping and building envelopes against high-wind standards, acknowledging the high concentration of named storm seasons documented since 1995.
Common mistakes when assessing weather trends
Public discourse surrounding weather history is often distorted by intuitive assumptions that conflict with meteorological facts. Avoiding these common analytical errors ensures a more grounded understanding of historical climate trends:
- Relying on selective childhood memories: Emotional recollection often spotlights an impressive blizzard or single hurricane from youth while completely forgetting months of mild, unremarkable weather.
- Assuming all storm types increase uniformly: Conflating the sharp, demonstrable increases in tropical cyclones and extreme precipitation with tornadoes, which instead show erratic, non-linear annual behavior.
- Confusing mean annual rainfall with extreme precipitation: Overlooking that average annual precipitation has increased only marginally, even as high-volume downpours have concentrated dramatically since the 1990s.
- Extrapolating tornado baselines beyond post-WWII data: Neglecting the fact that standardized severe convective storm logs only began after World War II, limiting century-long assertions.
- Ignoring mid-century warm anomalies: Dismissing anomalous periods such as the sustained warm window between 1939 and 1946 or exceptional historical outbreaks like the seven F5 tornadoes in 1974.
Frequently asked questions
Is the weather genuinely hotter now than it was fifty years ago?
Yes. Following an era of relative stability from 1946 through the late 1970s around the 20th-century baseline of 57.0 degrees Fahrenheit (13.9 degrees Celsius), global temperatures climbed sharply, culminating in 2016 reaching a full 1.0 degree Celsius above that century-long average.
How much longer do heat waves last today compared to the 1960s?
During the 1960s, heat waves typically lasted an average of three days and occurred about twice a year. By the 2020s, their duration doubled to an average of six days, their frequency doubled to four times per year, and their peak intensity was roughly 0.3 degrees hotter.
Why was the decade of the 1990s so important for rainfall records?
After nine decades of steady, consistent heavy rainfall days throughout the 1900s, the 1990s experienced a sudden surge. Nine of the heaviest precipitation days of the entire twentieth century occurred during that single decade.
Are tornadoes happening more frequently today than in the past?
Tornado trends do not show a steady, straightforward increase. Tornado frequency is highly erratic, with the top ten years on record distributed across almost every decade since World War II. For example, while 2016 saw high tornado numbers alongside record temperatures, 1974 remains the only year on record with seven F5 tornadoes.
How has tropical cyclone activity shifted since the 1970s?
In 1973, international agencies logged 118 cyclones worldwide. By 2018, global activity reached an all-time high of 150 storms, followed by 127 in 2021. In the United States, five of the six historical years with the most named tropical systems have taken place since 1995.
The bottom line
When evaluated through empirical meteorological archives rather than subjective human memory, the answer to whether weather is more extreme than fifty years ago is a measured, evidence-based yes—with distinct nuances depending on the storm type. The planet is demonstrably warmer, with global readings surpassing historical 20th-century benchmarks and culminating in milestones like 2016's record temperature anomaly.
This warming directly translates into heat waves that are twice as frequent and twice as long as those of the 1960s, a concentration of extreme single-day rainfall events that escalated sharply during the 1990s, and a clear rise in high-volume tropical cyclone seasons over the last three decades. Concurrently, phenomena like tornadoes caution us against sweeping generalizations, demonstrating that atmospheric volatility can remain erratic without following a simple linear trajectory. Recognizing these distinctions enables communities to plan infrastructure and emergency management based on recorded atmospheric reality.